> ## Documentation Index
> Fetch the complete documentation index at: https://docs.brightdata.com/llms.txt
> Use this file to discover all available pages before exploring further.
# Event Log
> How to read the Bright Data event log in the Zones dashboard to monitor recent proxy requests, IP usage, and zone activity at a glance.
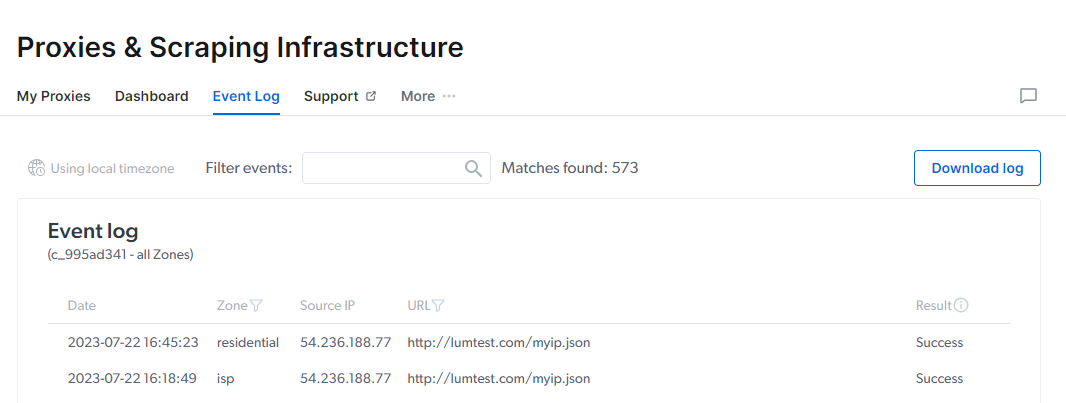
For a quick overview of your usage, go to the event sign in your Zones page:
 The event log will show you one line of data for the first request made with each unique IP in the past hour.
The presented data is:
* **Date:** Time and date of the request
* **Zone:** What Zone was used for the request
* **Source IP:** What IP the request was made from
* **URL:** The target site of the request
* **Result:** Success or Fail of the request
The event log will show you one line of data for the first request made with each unique IP in the past hour.
The presented data is:
* **Date:** Time and date of the request
* **Zone:** What Zone was used for the request
* **Source IP:** What IP the request was made from
* **URL:** The target site of the request
* **Result:** Success or Fail of the request