> ## Documentation Index
> Fetch the complete documentation index at: https://docs.brightdata.com/llms.txt
> Use this file to discover all available pages before exploring further.
# Monitor your Usage
> How to monitor your Bright Data residential proxy bandwidth consumption in real time using the Statistics view in the Control Panel.
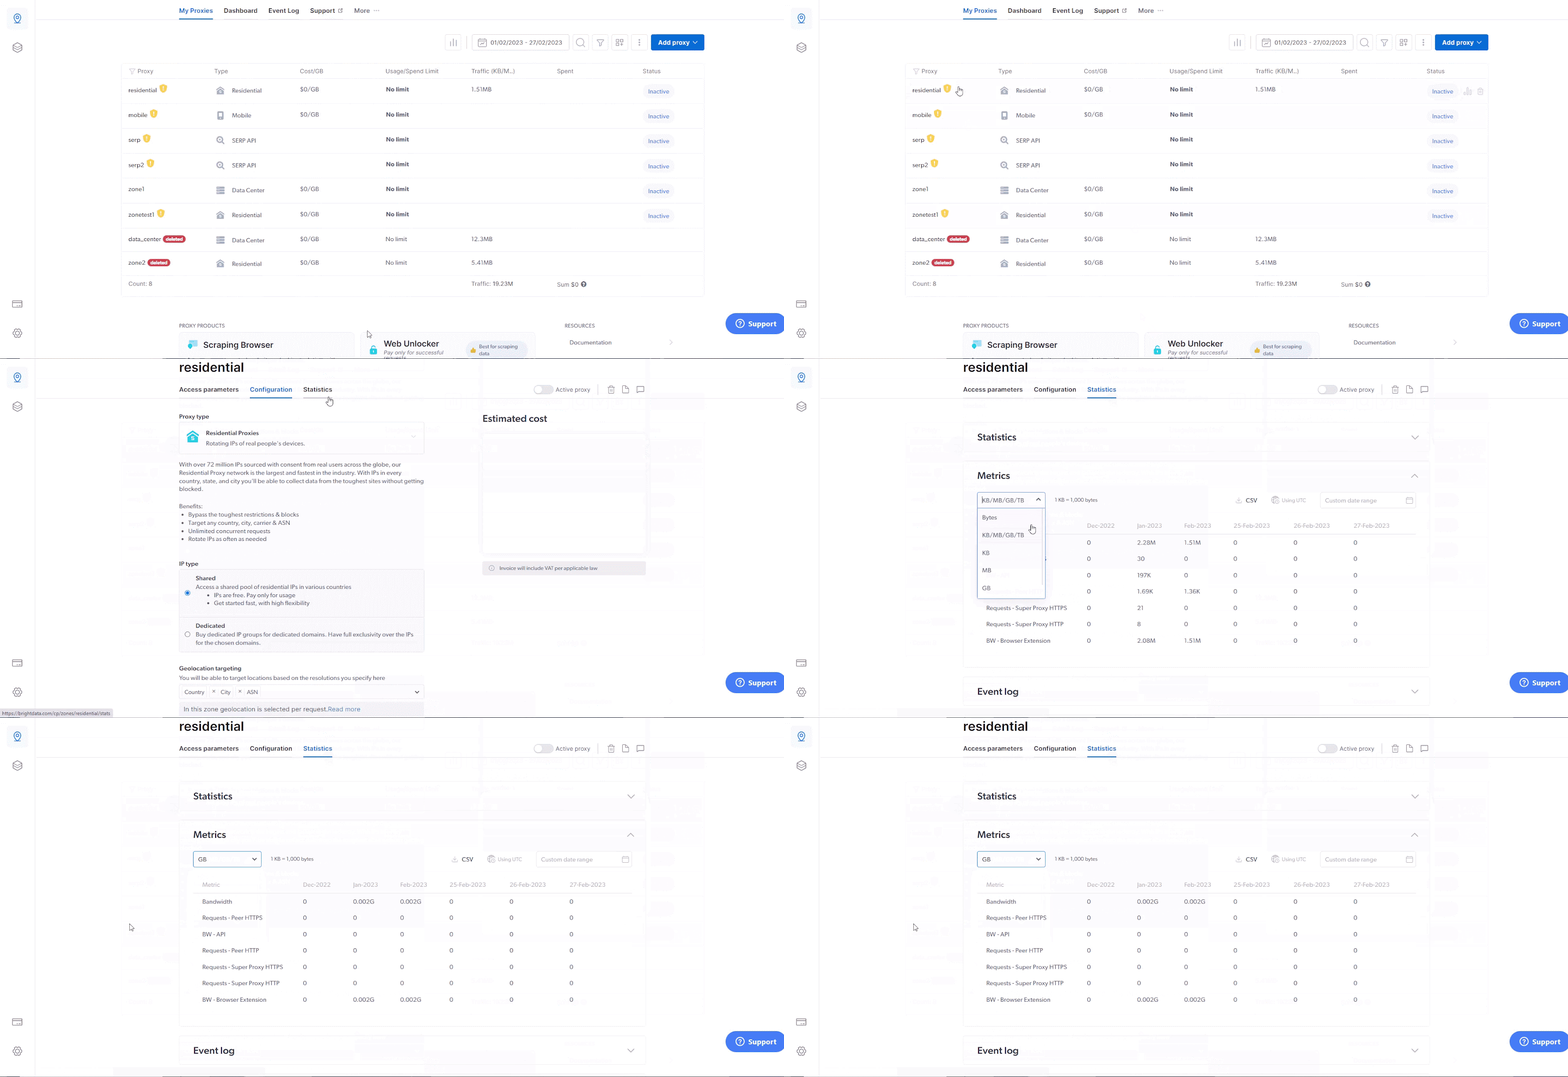
To review your current bandwidth consumption, simply browse to your [residential zone](https://brightdata.com/cp/zones), click on ‘Statistics’ in the top menu, in the ‘Metrics’ section, open the drop-down menu, and change the metric to ‘GB’.
 ## How Traffic Is Measured
Your usage of the residential proxy network is calculated via **bandwidth** consumption. Bandwidth is the amount of information that is sent over a connection and is being downloaded. Each request you send with your proxy consumes a certain amount of bandwidth. Your billing is calculated via \$ per # of bandwidth used.
See our [Billing & Pricing](/general/account/billing-and-pricing) page to learn more.
## How Traffic Is Measured
Your usage of the residential proxy network is calculated via **bandwidth** consumption. Bandwidth is the amount of information that is sent over a connection and is being downloaded. Each request you send with your proxy consumes a certain amount of bandwidth. Your billing is calculated via \$ per # of bandwidth used.
See our [Billing & Pricing](/general/account/billing-and-pricing) page to learn more.