

The Scrapers dashboard
Every scraper you use, whether generated by the AI Agent, built in the Bright Data Scraper Studio IDE, or built by Bright Data teams, appears under My Scrapers on the Scrapers dashboard.The My Scrapers page lists every scraper type, not only Scraper Studio scrapers.
Which scraper types appear on the dashboard?
The My Scrapers page lists three scraper types, distinguished by who builds and maintains each scraper.What does each scraper status mean?
Each scraper and run carries a status that shows where it is in the build and collection lifecycle.
To open a specific scraper’s dashboard, click the scraper.
What does the collection Runs page show?
The Runs page shows per-collection metrics for every run of a scraper.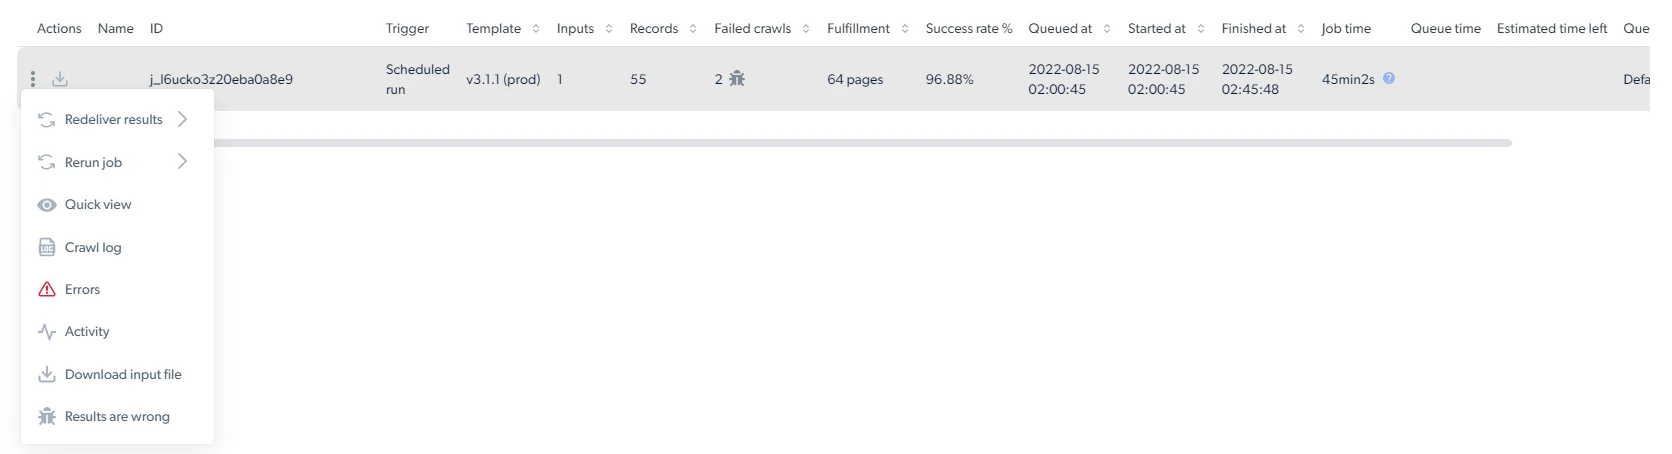

Collection run actions
The three-dot Actions menu includes the following options. Available actions may vary depending on the run status and delivery configuration.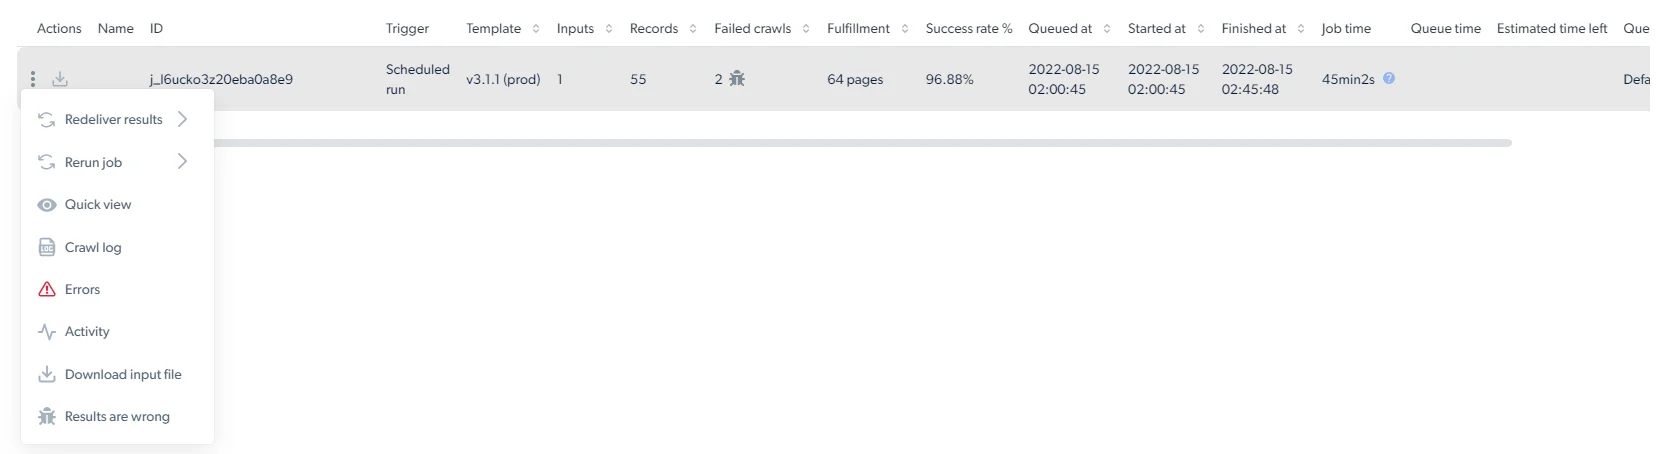
Redeliver results
Use Redeliver results to send collected results again to the configured delivery destination. You can choose:- Dataset only, redelivers only the structured output data.
- Dataset + media, redelivers the structured output data together with collected media files, such as images, videos, PDFs, or documents.
Rerun or cancel a collection
Use Rerun job to start a new run from an existing collection. You can choose:- Rerun all from beginning, starts a new run using all original input values.
- Rerun failed pages, starts a new run only for pages that failed in the selected collection.
Inspect results and errors
Use Quick view to preview up to 100 collection records in JSON format directly in the control panel. Use Errors to review failed inputs and error details. Use Activity to monitor a collection run over time. The page shows run status, start and finish times, success rate, crawl count, and performance charts. You can change the visible time range, such as 5 min, 1 h, 1 d, or all. The Activity page includes:- Run rate - shows how many pages were crawled, failed, or retried at each point in time, along with the success rate.
- Pages - shows discovered pages, open pages, retriable pages, and pages currently being crawled.
- Inputs - shows how many input rows were submitted and prepared for crawling.
- Crawl rate - shows the system-calculated maximum number of allowed workers and the actual number of workers assigned to the run.
- Crawl time per page - shows the average time spent crawling each page.
Debug crawl
Use Debug crawl to investigate failed or unexpected scraper behavior.How do I download the data from the dashboard?
Click the Download file options button, select a file format, and the download starts immediately.Real-time job outputs are stored on Bright Data’s side but cannot be downloaded from the dashboard. To retrieve them, use the Scraper Studio API or send them to one of the delivery destinations configured in your delivery options.
How do I trigger a scraper and get results?
To trigger a scraper, use the three initiation options documented on Initiate collection and delivery: To retrieve results, open the scraper from My scrapers and select Runs tab. This opens the collection statistics page, where you can download the data.Related
Initiate collection and delivery
Configure trigger methods, file formats and delivery destinations
Scraper Studio IDE interface
Reference for every panel and control in the IDE