What the IDE panel contains
The IDE panel is where you write and test your scraper code. Each labeled component below corresponds to a section of the IDE interface.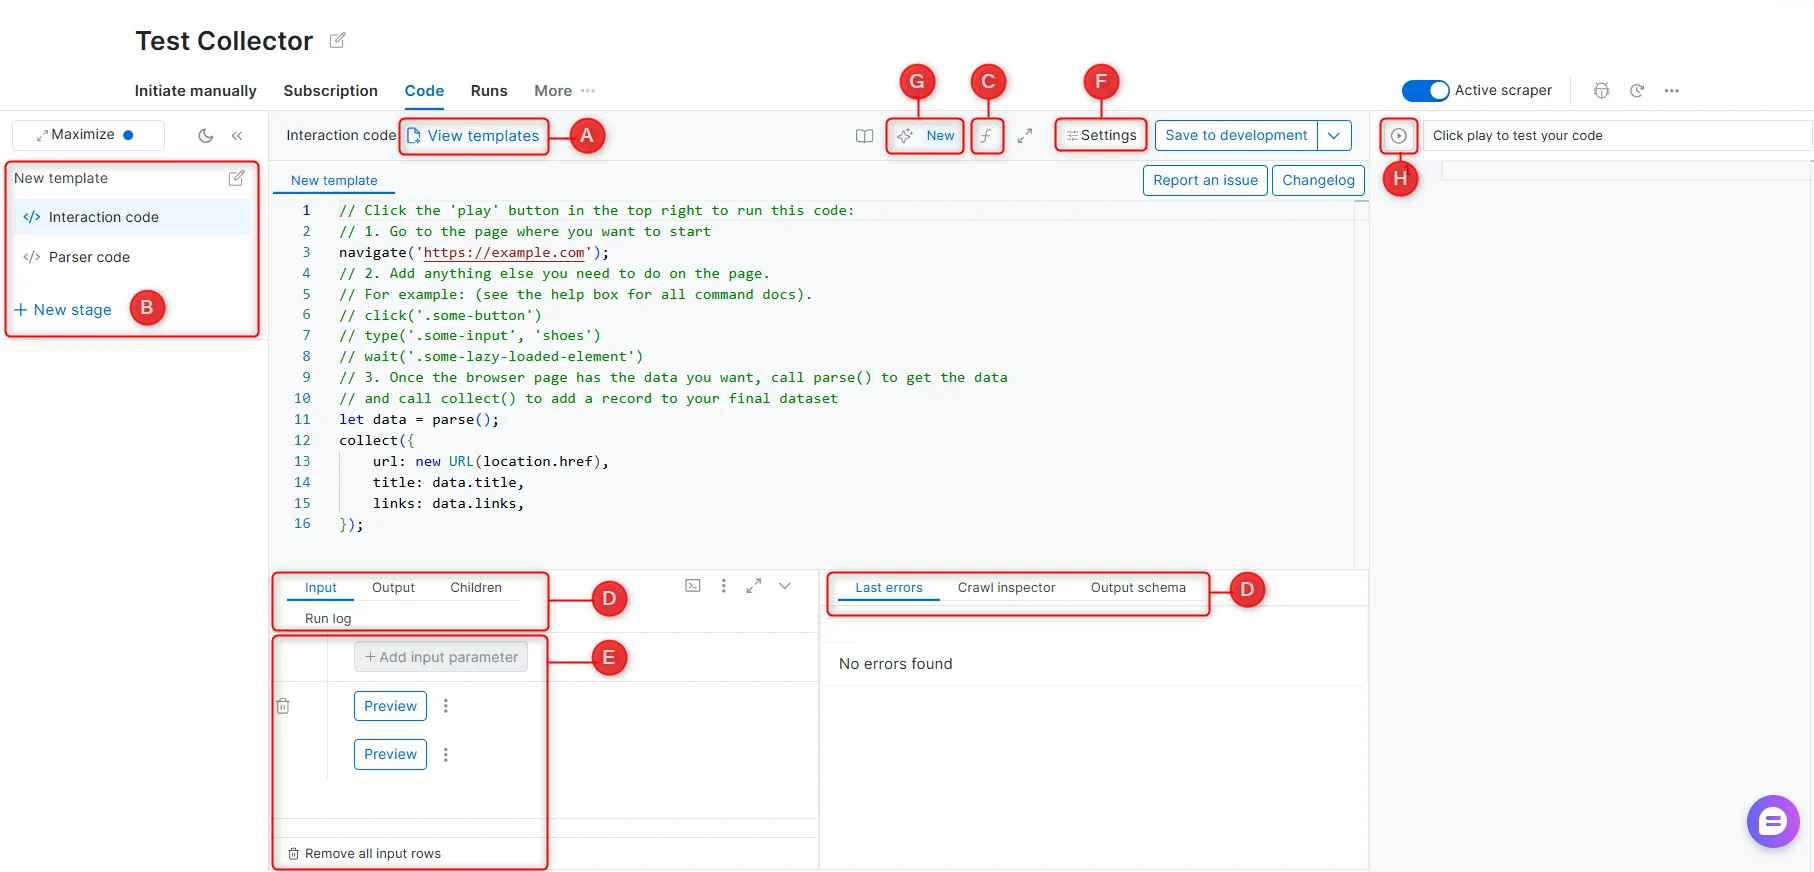
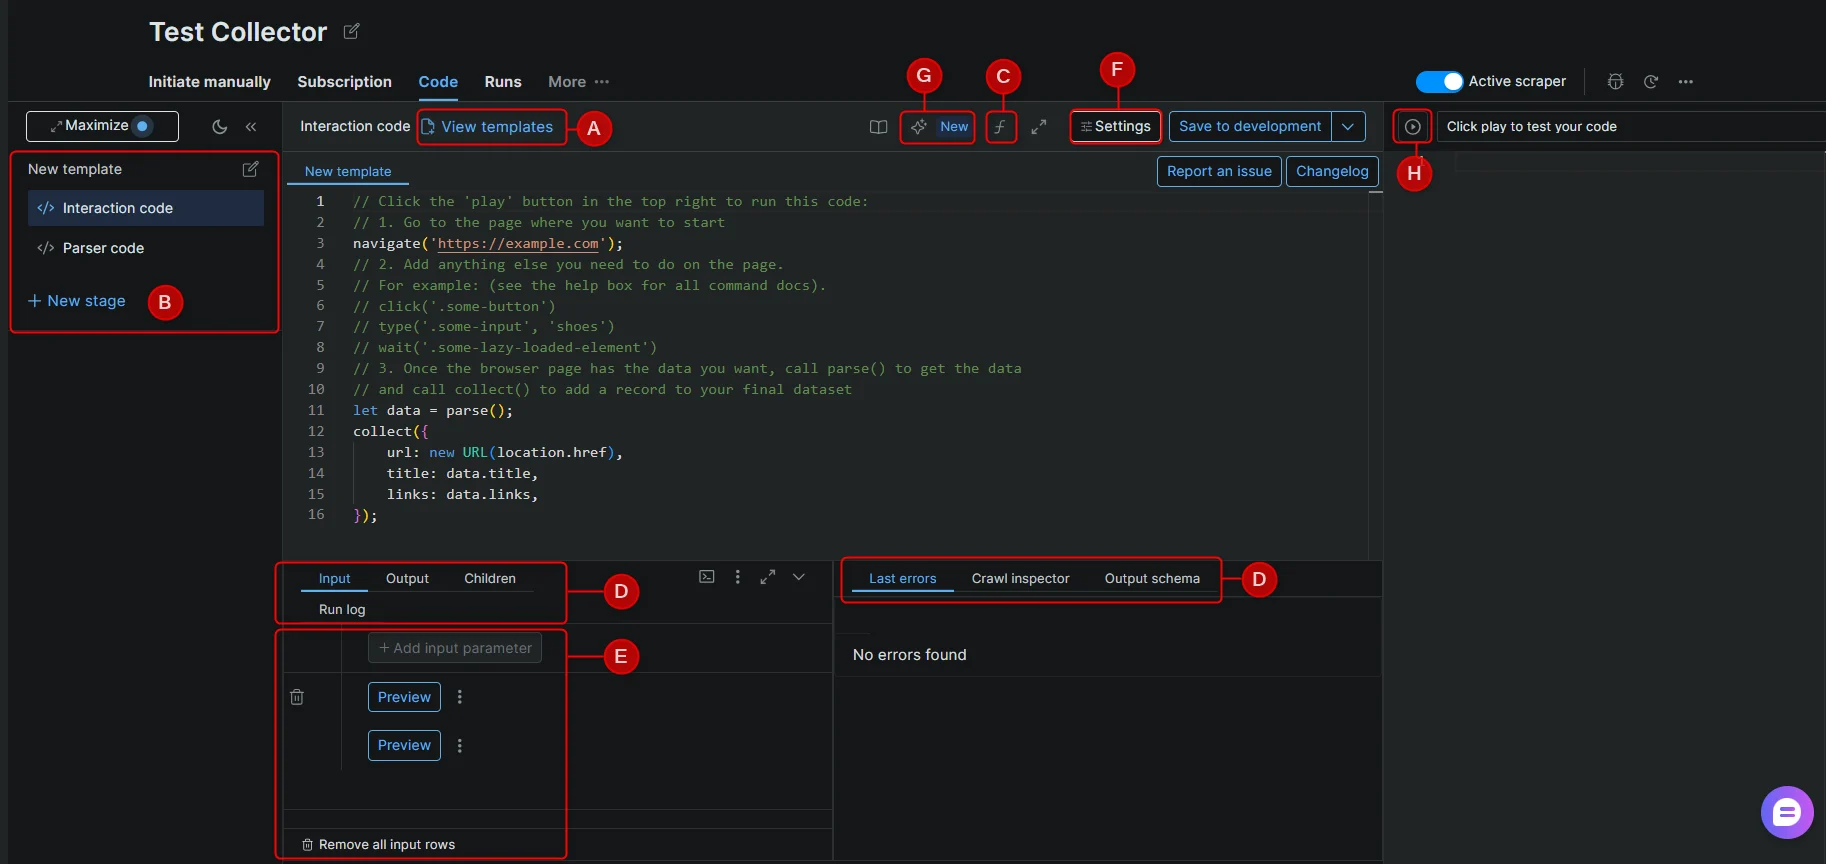
A - Templates
A library of pre-built scraper code created by Bright Data’s engineers, covering common websites and scraping patterns. Templates are starting points and may require adjustments if a target website’s structure has changed.B - Stages
Stages allow a scraper to operate across multiple steps in sequence. Each stage receives input from the previous one via next_stage() or run_stage(). Use stages when scraping requires navigating across multiple page types - for example, collecting URLs from a listing page, then extracting details from each URL.See Scraper Studio functions for the full command reference.
C - Functions reference
An in-IDE reference panel listing all available scraping functions with descriptions and usage examples.See Interaction functions and Parser functions.
D - Debugging tabs
| Tab | Description |
|---|---|
| Input | Define input parameters and select an input set to run a preview test |
| Output | Structured data returned by the scraper after a preview run |
| Children | Input sets passed to the next stage in a multi-stage scraper |
| Run log | Full code execution log for the most recent preview |
| Browser network | Browser-level network activity log (equivalent to DevTools > Network tab) |
| Last errors | The most recent error messages, including error codes and affected inputs (last 1,000 stored) |
| Crawl inspector | All pages crawled during a batch job, including successes and failures. For multi-stage scrapers, use Search for children to view pages generated from each parent |
| Output schema | Field names and data types for the scraper’s output. Click Edit Schema to modify input or output schema |
Preview output modes
When you run a preview, the Output tab can show results in two modes: Raw output - shows the records exactly as they were collected by the scraper code, before schema formatting or processing is applied. Formatted output - shows the records after they are processed according to the output schema, including field types, formatting rules, default values, validation, and other schema settings. Use Raw output when debugging parser code or checking what collect() returned. Use Formatted output when verifying the final structure that will be delivered in production runs. For example, a price field may appear as raw text in Raw output, but as a structured price object or formatted value in Formatted output, depending on the output schema configuration.E - Input
| Control | Description |
|---|---|
| Add input parameter | Define a new input parameter by name and type |
| New input | Add a value to an input set for testing |
| Preview | Run the scraper against a selected input set |
F - Settings
| Setting | Description |
|---|---|
| Worker | Select Browser Worker or Code Worker for this scraper |
| Error mode | Define scraper behavior when an error occurs |
| Take screenshot | Capture screenshots of loaded pages during preview runs |
| Worker per stage | Assign a different worker type to each stage instead of using one worker for the whole scraper |
See Worker types for guidance on choosing between Browser worker and Code worker.
G - Self-Healing Tool
AI-powered code refactor. Accepts plain-language prompts to fix errors or modify input/output fields without manual code editing.See Self-Healing tool.
H - Preview
Preview runs the scraper code against the input selected in the Input tab at the bottom-left of the IDE. Use it to test your interaction and parser logic before saving the scraper to production. Preview results appear in the Output debugging tab. Scraper Studio provides two preview modes:- Preview (browser), runs the scraper in an interactive browser view. Use this mode to inspect page behavior, clicks, scrolling, JavaScript rendering, and browser-only interactions.
- HTML, shows the loaded page HTML or response content used by the parser. Use this mode to debug selectors, parser logic, and extracted fields.
Scraper Dashboard Menu
The Dashboard lists all your scrapers under My Scrapers. Each scraper has an action menu with the following options:| Action | Description |
|---|---|
| Initiate manually | Start a collection run directly from the UI. See Initiate manually. |
| Initiate by API | Trigger a collection programmatically via API. See Initiate via API |
| Run on schedule | Configure a recurring collection - daily, weekly, or at a custom interval |
| Delivery preferences | Set the output format and delivery destination for completed jobs |
| Code | Open and edit the scraper in the IDE |
| Report an issue | Submit a report for platform, scraper, or data quality issues |