Functions
Features
Data scraper Dashboard

Overview
- Free trial: As part of the 7-day free trial, you’re entitled to 1,000-page loads
- Update available: A new version of the scraper is available. If there is no update button, you have the latest version.
- Properties: This is where you’ll see all the scraper properties. Learn more
- Delivery preferences: Choose your desired file format, delivery method, and notification settings. Learn more
- Output configuration/ Schema: Here, you can go back to edit your output definitions. Learn more
- Limitations - Our collectors have a limitation of 100 parallel-running jobs. When more than 100 jobs are triggered, the additional jobs are placed in a queue and wait until the earlier ones finish.
Scraper action menu
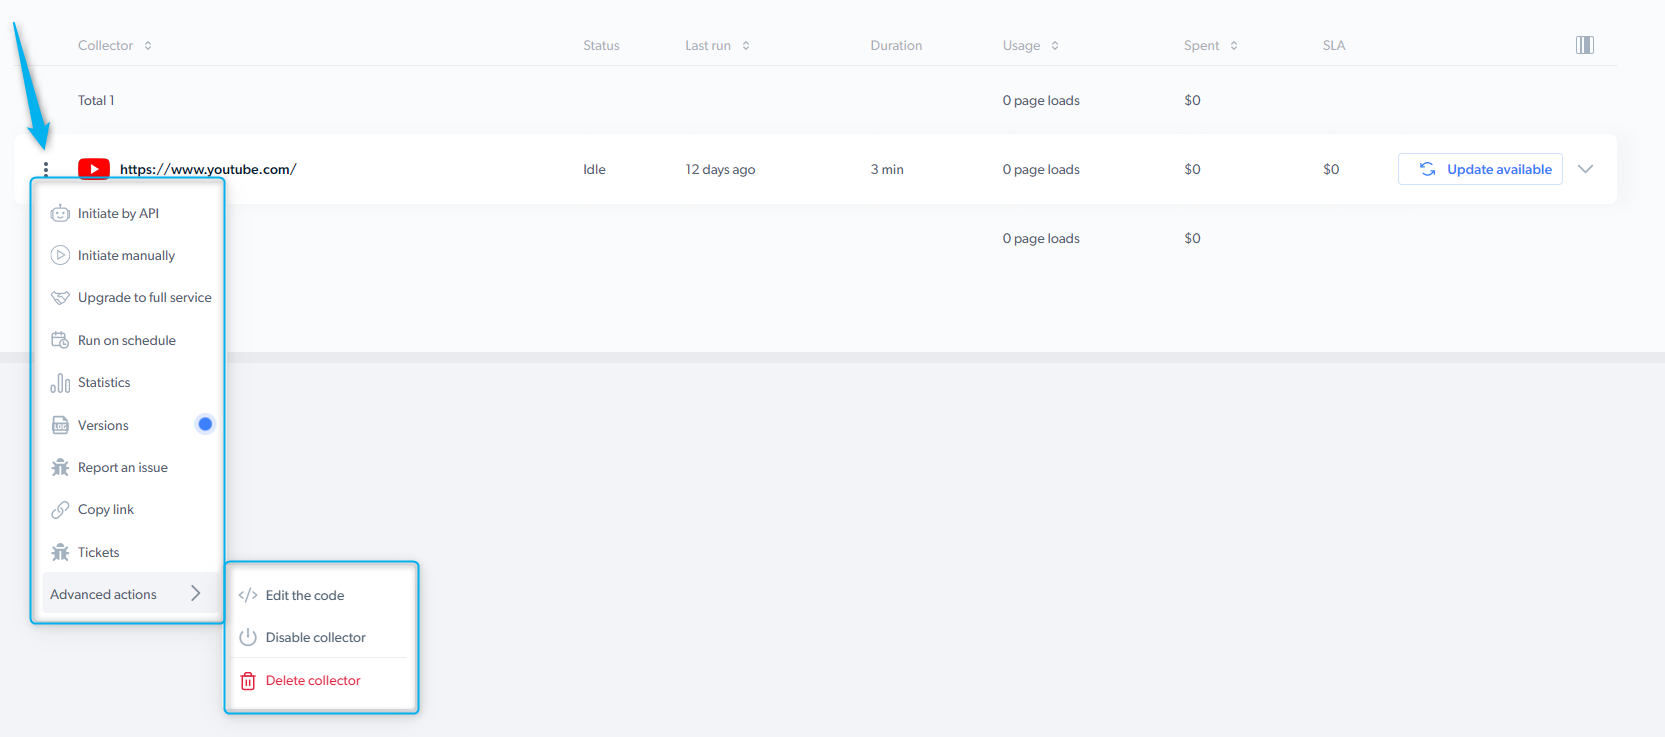
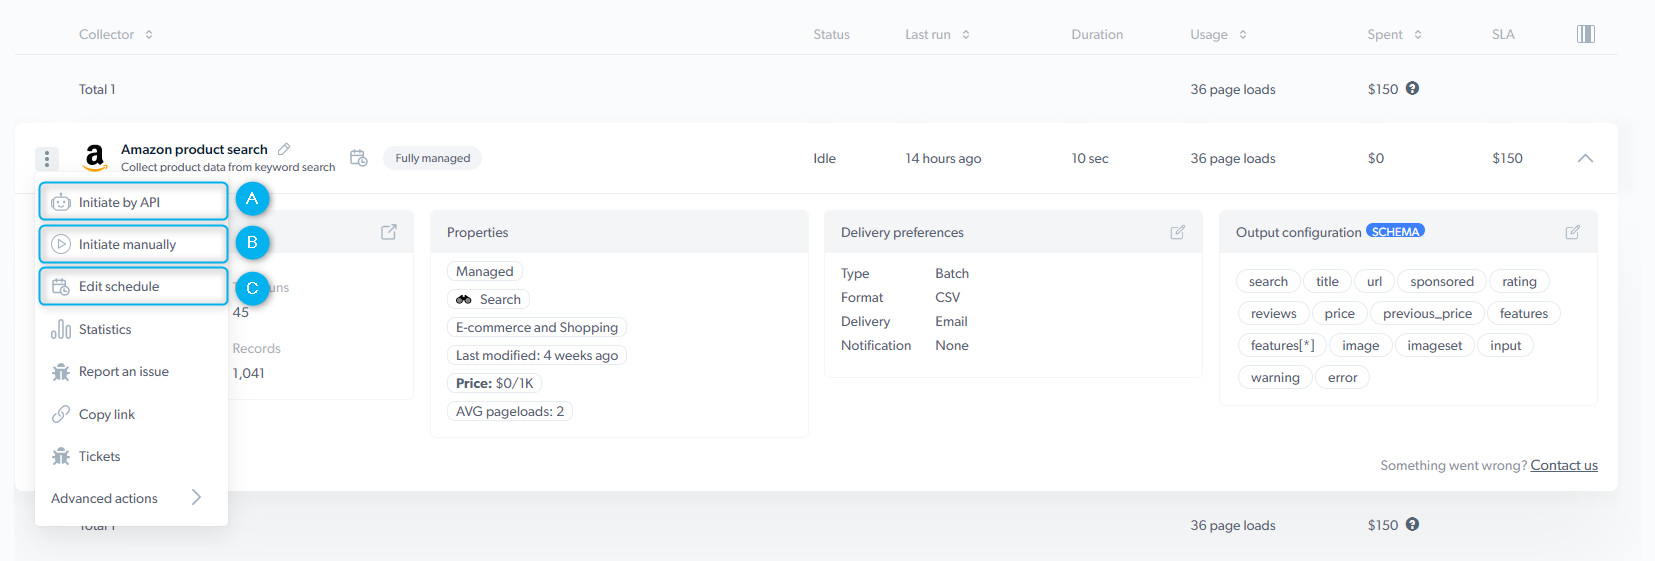
The scraper action menu allows performing different actions with the scraper.- Initiate by API - start a data collection without having to enter the control panel
- Initiate manually - Bright Data’s control panel makes it easy to get started collecting data
- Run on schedule - select precisely when to collect the data you need
- Versions - review the modified versions of the scraper
- Report an issue - You can use this form to communicate any problems you have with the platform, the scraper, or the dataset results
- Copy link - copy the link of the scraper to share it with your colleagues
- Tickets - view the status of your tickets
-
Advanced options:
- Edit the code - edit the scraper’s code within the IDE.
- Disable scraper - temporarily disable the scraper, but you can reactivate it if needed.
- Delete scraper - permanently delete the scraper.

Properties:

-
Maintainer of the scraper :
- Self-serve: scraper is maintained by you
- Full-service: scraper is maintained by Bright Data Developers
-
Type of the scraper :
- Search : The scraper input is a keyword (i.e., iPhone)
- PDP : The scraper input is a product page URL
- Discovery : The scraper input is a category URL
- Other
- Use case of the scraper (Social media, eCommerce, Travel, etc.)
- Last modified : indicates when the scraper was last updated
- Price of CPM : 1 CPM = 1,000 page loads.
- Avg. Page-load per input : Average number of loaded pages to process 1 input set
Initiate scraper and get collection results
Initiate scraper To start collecting the data, you have three options: A. Initiate by API B. Initiate manually C. Schedule a scraper Get collection results
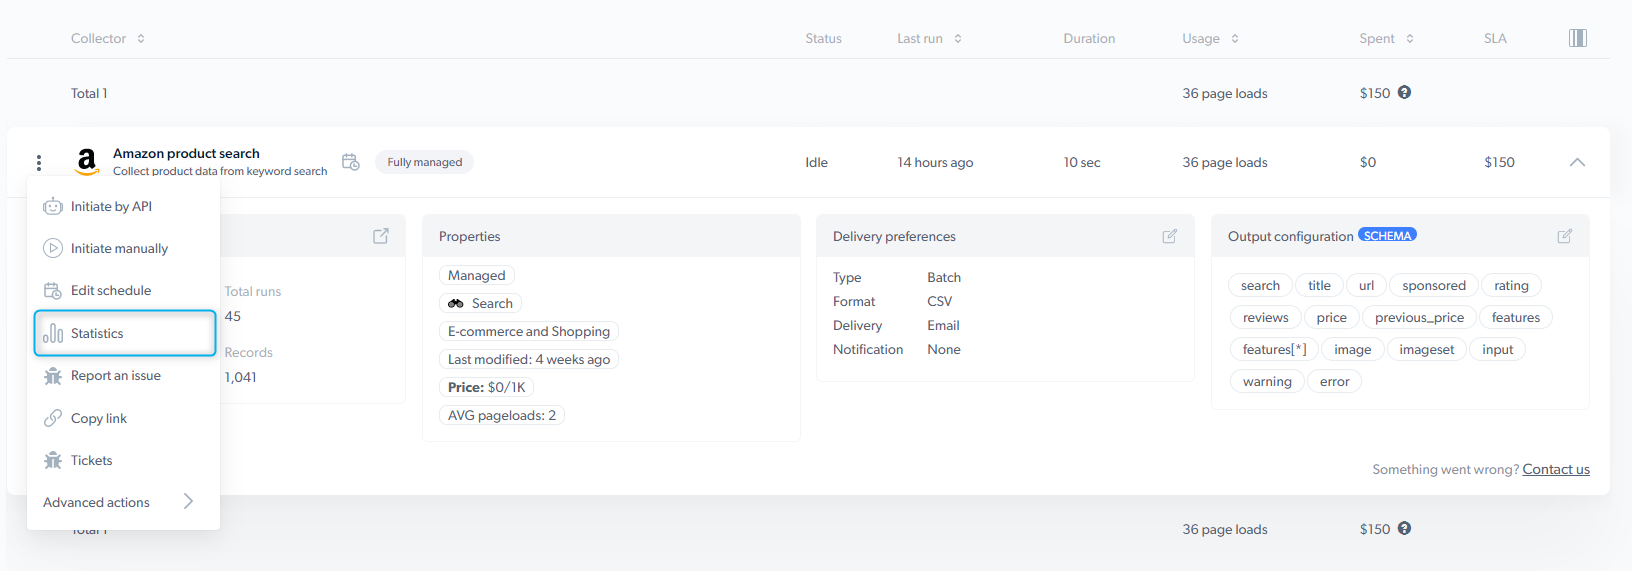
Once the data collection is completed, click the “three dots” icon and select “Statistics” to access the results and download the data.
Realtime job input and output cannot be downloaded since it is not stored on our end
Statistics
 The statistics page presents essential information about the success of the data collection. Below is a list of all the terms included in the statistics table:
Statistics actions menu

- 3 dots Here you can perform different functions with the data collection job: The statistics page presents essential information about the success of the data collection. Below is a list of all the terms included in the statistics table:

- Job ID - The unique id of the collection
- Trigger - The person who initiated the data collection and how (API, manually or scheduled)
- Inputs - The number of inputs inserted into the collection
- Records - The number of results collected
- Failed - The number of pages failed to be crawled
- Success rate - The percentage of the results that were successfully collected
- Queued at - The queue timestamp
- Started at - The date and time when the scraper began collecting
- Finished at - The date and time when the scraper finished collecting
- Job time - The length of time it took to complete
- Estimated time left - The amount of time left until collection is complete
- Queue - The name of the job given in the trigger behavior (Queue name)
- Usage - The total amount of page loads used


